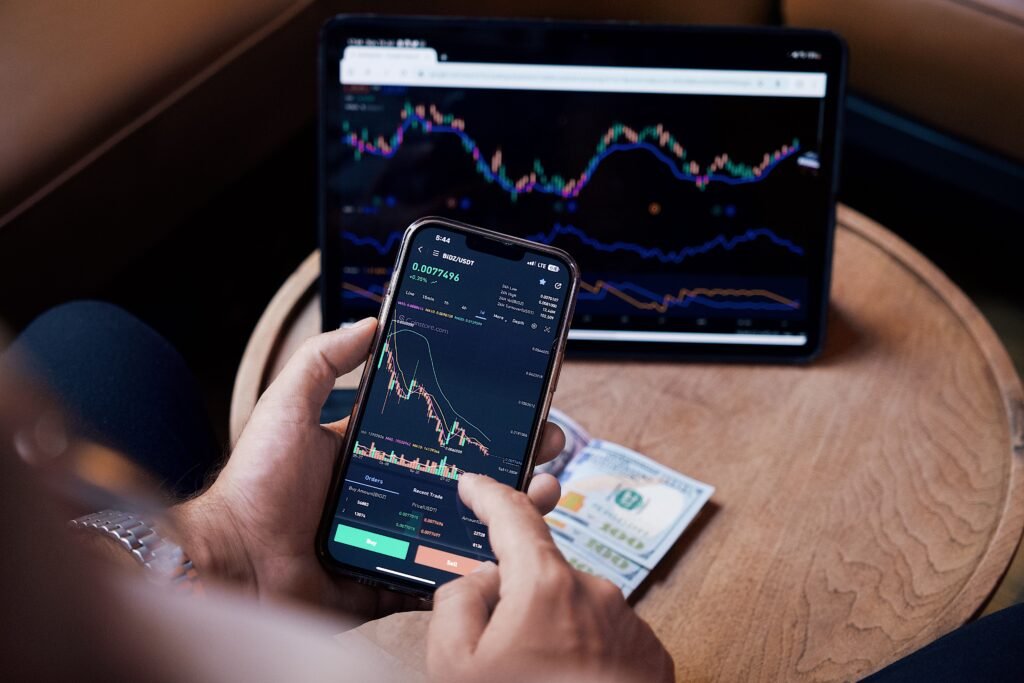
Most traders get burned by one thing before they ever blow up on a bad call. Their testing was off. Not the strategy, the testing. They ran something on historical data, saw a pretty equity curve, and went live thinking they’d found gold. Then the market did what it always does, which is something slightly different than the past. Let’s talk about why that happens and how to stop it.
What Does an Options Backtester Actually Do?
An options backtester takes a trading rule, runs it against old market data, and shows you how it would have performed. Sounds simple, right? It isn’t. Stocks are easy because you’ve got one price moving through time. Options are a mess by comparison. Every contract has a strike, an expiration, an implied volatility, a bid and an ask, and Greeks that shift daily. So when you test a strategy, you’re really testing hundreds of moving pieces at once. The short answer is that a good tool replays the market as it looked on each day, then applies your entry and exit rules and tallies the result. A bad tool just guesses at prices and hopes you don’t notice. And plenty of them do exactly that, which is why people lose money trusting numbers that were never real in the first place.
Why Historical Option Data Is Harder Than You Think
Truth is, the data is the whole game. If your options history is incomplete, smoothed over, or built from end-of-day snapshots only, your results will look cleaner than reality ever was. Think about a thinly traded strike three months out. On paper it had a mid price. In real life you’d have paid the ask and sold at the bid, and the gap between them could eat half your edge. Good backtesting software pulls in actual quotes, handles splits and dividends properly, and doesn’t skip the ugly days. Bad data skips them. Watch out for gaps around earnings, around holidays, around those weird Fridays when everything seems to freeze up. You want the full, uncomfortable record, not a highlight reel of the days that behaved.
Slippage, Commissions and the Stuff Everyone Forgets
Here’s where backtests quietly fall apart. Traders model the entry and the exit and forget the friction in between. Commissions on a four-leg iron condor add up fast. Slippage adds up faster. If you trade ten contracts and each leg costs you a few cents more than the mid, that’s not nothing, it’s a real drag every single time you open or close. Over a hundred trades it can flip a winning system into a loser. Let’s be real, most people never account for this. They see a 62 percent win rate and stop thinking. But a high win rate with small winners and occasional large losses can still bleed you dry once costs are in. So build the costs into the test from day one, even if the numbers look worse. Worse numbers that are honest beat great numbers that are fake.
Overfitting: The Silent Killer of Good Strategies
This one gets people constantly. You tweak a delta here, a days-to-expiration setting there, and suddenly the strategy prints money across five years of data. Congratulations, you’ve built something that perfectly describes the past and tells you almost nothing about next month. That’s overfitting, and it’s sneaky because it feels like progress. Every adjustment feels smart. The fix isn’t complicated, though it takes some discipline. Split your data, build on one chunk, then test on a chunk the system has never seen. If it falls apart on the fresh data, trust that result over the pretty one. Also, fewer rules is usually better. A strategy with twelve conditions is probably memorizing noise, not catching a real pattern in how premiums behave.
Where Option Chain Analysis Software Fits In
Now here’s the part that connects everything. Testing tells you what worked. But picking the actual contracts today requires looking at the live board, and that’s where option chain analysis software earns its keep. A chain can have thousands of rows. Strikes, expirations, open interest, volume, skew, all stacked together. Reading that by eye is slow and honestly error-prone. Good software lets you sort, filter, and compare contracts quickly, so you can spot where volume is clustering or where implied volatility looks rich compared with its own history. The best workflow, in my view, is using the tester to define what you want, then using chain tools to find the closest match in the market right now. One without the other leaves a gap. You either have a theory with no execution, or execution with no proof.
Reading the Results Without Fooling Yourself
Say you’ve run a test. What do you look at? Not just total return. Check the maximum drawdown, because that tells you how much pain you’d have sat through. Check how long the losing stretches lasted, since a strategy that loses for eight months straight will test your nerve more than any chart suggests. Look at the number of trades too. Thirty trades isn’t a sample, it’s an anecdote. And compare the result to simply holding the underlying, because sometimes the fancy options play barely beats doing nothing. Sharpe ratio, profit factor, average win versus average loss, all useful, none of them magic. The point is to understand the shape of the outcomes, not to chase one flattering number that confirms what you hoped to see.
Common Mistakes Beginners Keep Making
A few patterns show up again and again. People test only the bull market years and assume the results hold everywhere. They ignore early assignment risk on short American-style options. They size positions the same way in a backtest as they’d never dare in real life. And they treat a single good run as proof. It’s not proof. It’s a hint. Another big one, honestly, is skipping volatility regimes. A short premium strategy that crushed it during calm 2017 behaves very differently in March 2020. Make sure your sample includes the scary stretches, the crashes, the sudden spikes. If it doesn’t, you’re not testing a strategy, you’re testing a mood. Stress it, break it, then see what’s left standing afterward.
Choosing Tools That Actually Help You Decide
So what should you look for? Reliable historical quotes, realistic fill assumptions, support for multi-leg structures, and the ability to adjust or roll positions the way you would live. Speed matters too, because slow tools mean fewer experiments and fewer experiments mean less learning. A decent options backtester should also let you export results so you can look at them outside the platform. Don’t get dazzled by dashboards. Flashy charts are cheap to build. Ask instead whether the engine underneath treats your trades like real trades. Try a strategy you already know the outcome of and see if the tool agrees with your actual records. If it can’t reproduce something you lived through, don’t trust it with something you haven’t.
Final Thoughts: Test Hard, Trade Smaller
Look, no tool predicts the future, and anyone selling that is selling something else. What a solid testing process gives you is a clearer view of risk, a feel for how a strategy breathes over time, and fewer ugly surprises. Pair that with decent option chain analysis software for picking real contracts, and you’ve got a workflow that actually respects how messy markets are. Start small. Be suspicious of great results. Add costs, check the data, and test on stuff the system hasn’t seen. Do that consistently and you’ll still lose sometimes, everybody does, but you’ll know why. And knowing why is most of the edge anyone ever really gets.